- What can this tool be used for?
- View the probability (annual chance) of coastal flooding now and in the future under the Intermediate and High sea level rise scenarios. It does NOT include wave impacts.
- Determine the elevation of a building or asset and understand how often it may flood now and in the future
- Determine an appropriate design height for an asset based on flood risk tolerance and expected lifespan
- What are the important limitations of this tool?
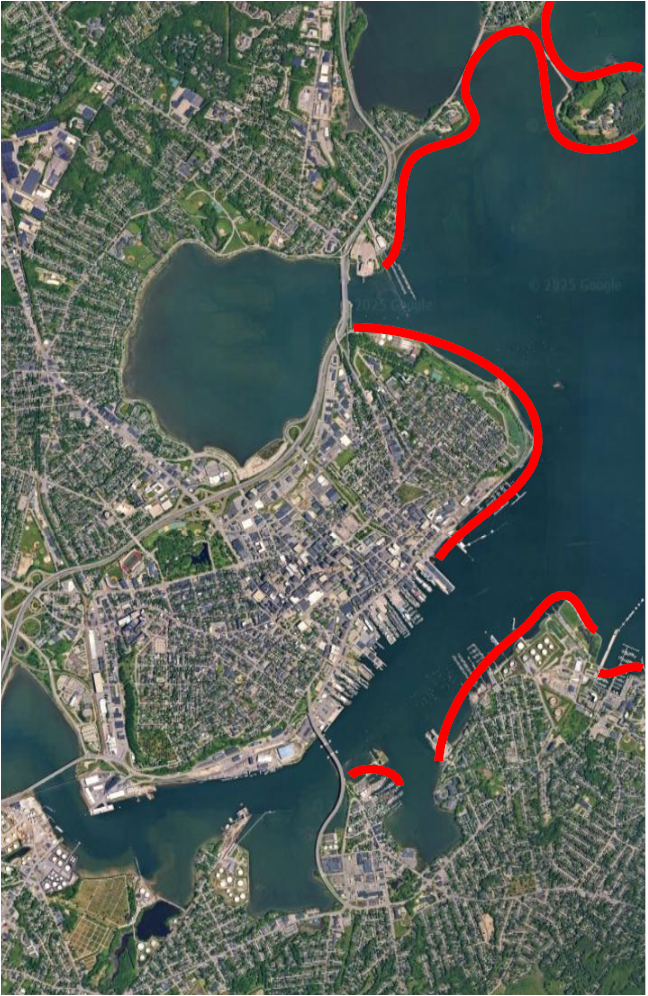
- It does not include wave impacts (only sea level rise, tides, and storm surge). For areas exposed to waves, flood hazard may be significantly higher than indicated here. Use local knowledge and consult FEMA Flood Insurance Rate Maps to estimate local wave exposure. Areas labeled as “VE zones” may be exposed to waves greater than 3 feet. The areas highlighted in red on the map include VE zones.
- These flood risk estimates only consider long-term sea level rise and do not account for monthly and yearly fluctuations in tides and sea level. For example, although flooding may occur an average of once per month over a 5-year period, there may be months where flooding occurs 5 to 10 times because tides are large and atmospheric conditions are temporarily raising average sea level
- It assumes that tides and surge will have the same magnitude in the future when sea level is higher. In reality, tides and surge may behave differently in deeper water (caused by higher sea level)
- How do I view elevations relative to the NAVD88 datum instead of the MLLW datum?
- The short answer: To convert elevations from MLLW to NAVD88, subtract 5.26 ft (1.60 m)
- The details: Water and ground elevations are provided relative to the National Tidal Datum Epoch (1983-2001) MLLW vertical datum. Ground elevations are derived from the
2022-2023 NOAA NGS Topobathy Lidar, which were downloaded in the NAVD88 vertical datum. We used the measured MLLW-NAVD88 offset at the Portland NOAA tide gauge to convert ground elevations to MLLW.
The VDatum model estimates that this offset varies by 3 cm over the geographic area of this tool (1.58-1.60 m), so applying the same offset everywhere is a reasonable assumption.
- Why is the tool limited to the area around Portland?
- A long record of measured water level (multiple decades) is required to calculate extreme water level statistics (the relationship between water level and the percent chance that it occurs). These statistics were calculated from more than 100 years of water level measurements recorded at the Portland tide gauge, which is operated by NOAA and located at Ocean Gateway Pier. Therefore, we only provide flood risk information in mostly wave-sheltered areas where high water levels are very close to the high water level at Ocean Gateway Pier. When the statewide Maine Coastal Flood Risk Model is finished, we hope to expand the geographic extent of this tool.
- It assumes that tides and surge will have the same magnitude in the future when sea level is higher. In reality, tides and surge may behave differently in deeper water (caused by higher sea level)
- What are the data sources for this tool?
- Extreme water level statistics were calculated using measured water levels from the Portland NOAA tide gauge (station 8418150) 1910-2024, the joint tide-surge probability method in
Baranes et al. (2020)
for annual exceedances less than 1, and the empirical distribution for exceedances greater than or equal to 1. Note that we calculated statistics using a full nodal cycle offor future years, rather than the predicted tides for each individual year.
- The Intermediate and High sea level rise scenarios are the
U.S. Interagency Task Force scenarios at the Portland tide gauge from Sweet et al. (2022). These are the same scenarios used by the Maine Climate Council.
- Land surface elevations are from the 2022-2023 NOAA NGS Topobathy Lidar: Coastal Maine, downloaded as a 1-meter DEM from the NOAA Data Access Viewer.