The science
THIS ENTIRE PAGE NEEDS WORK
Exceedance II (tidy data)
- Scenario is either "Hi50" or "Int50"
- Exceedance units: exceedances/year
- Elevation units: meters above NAVD 88
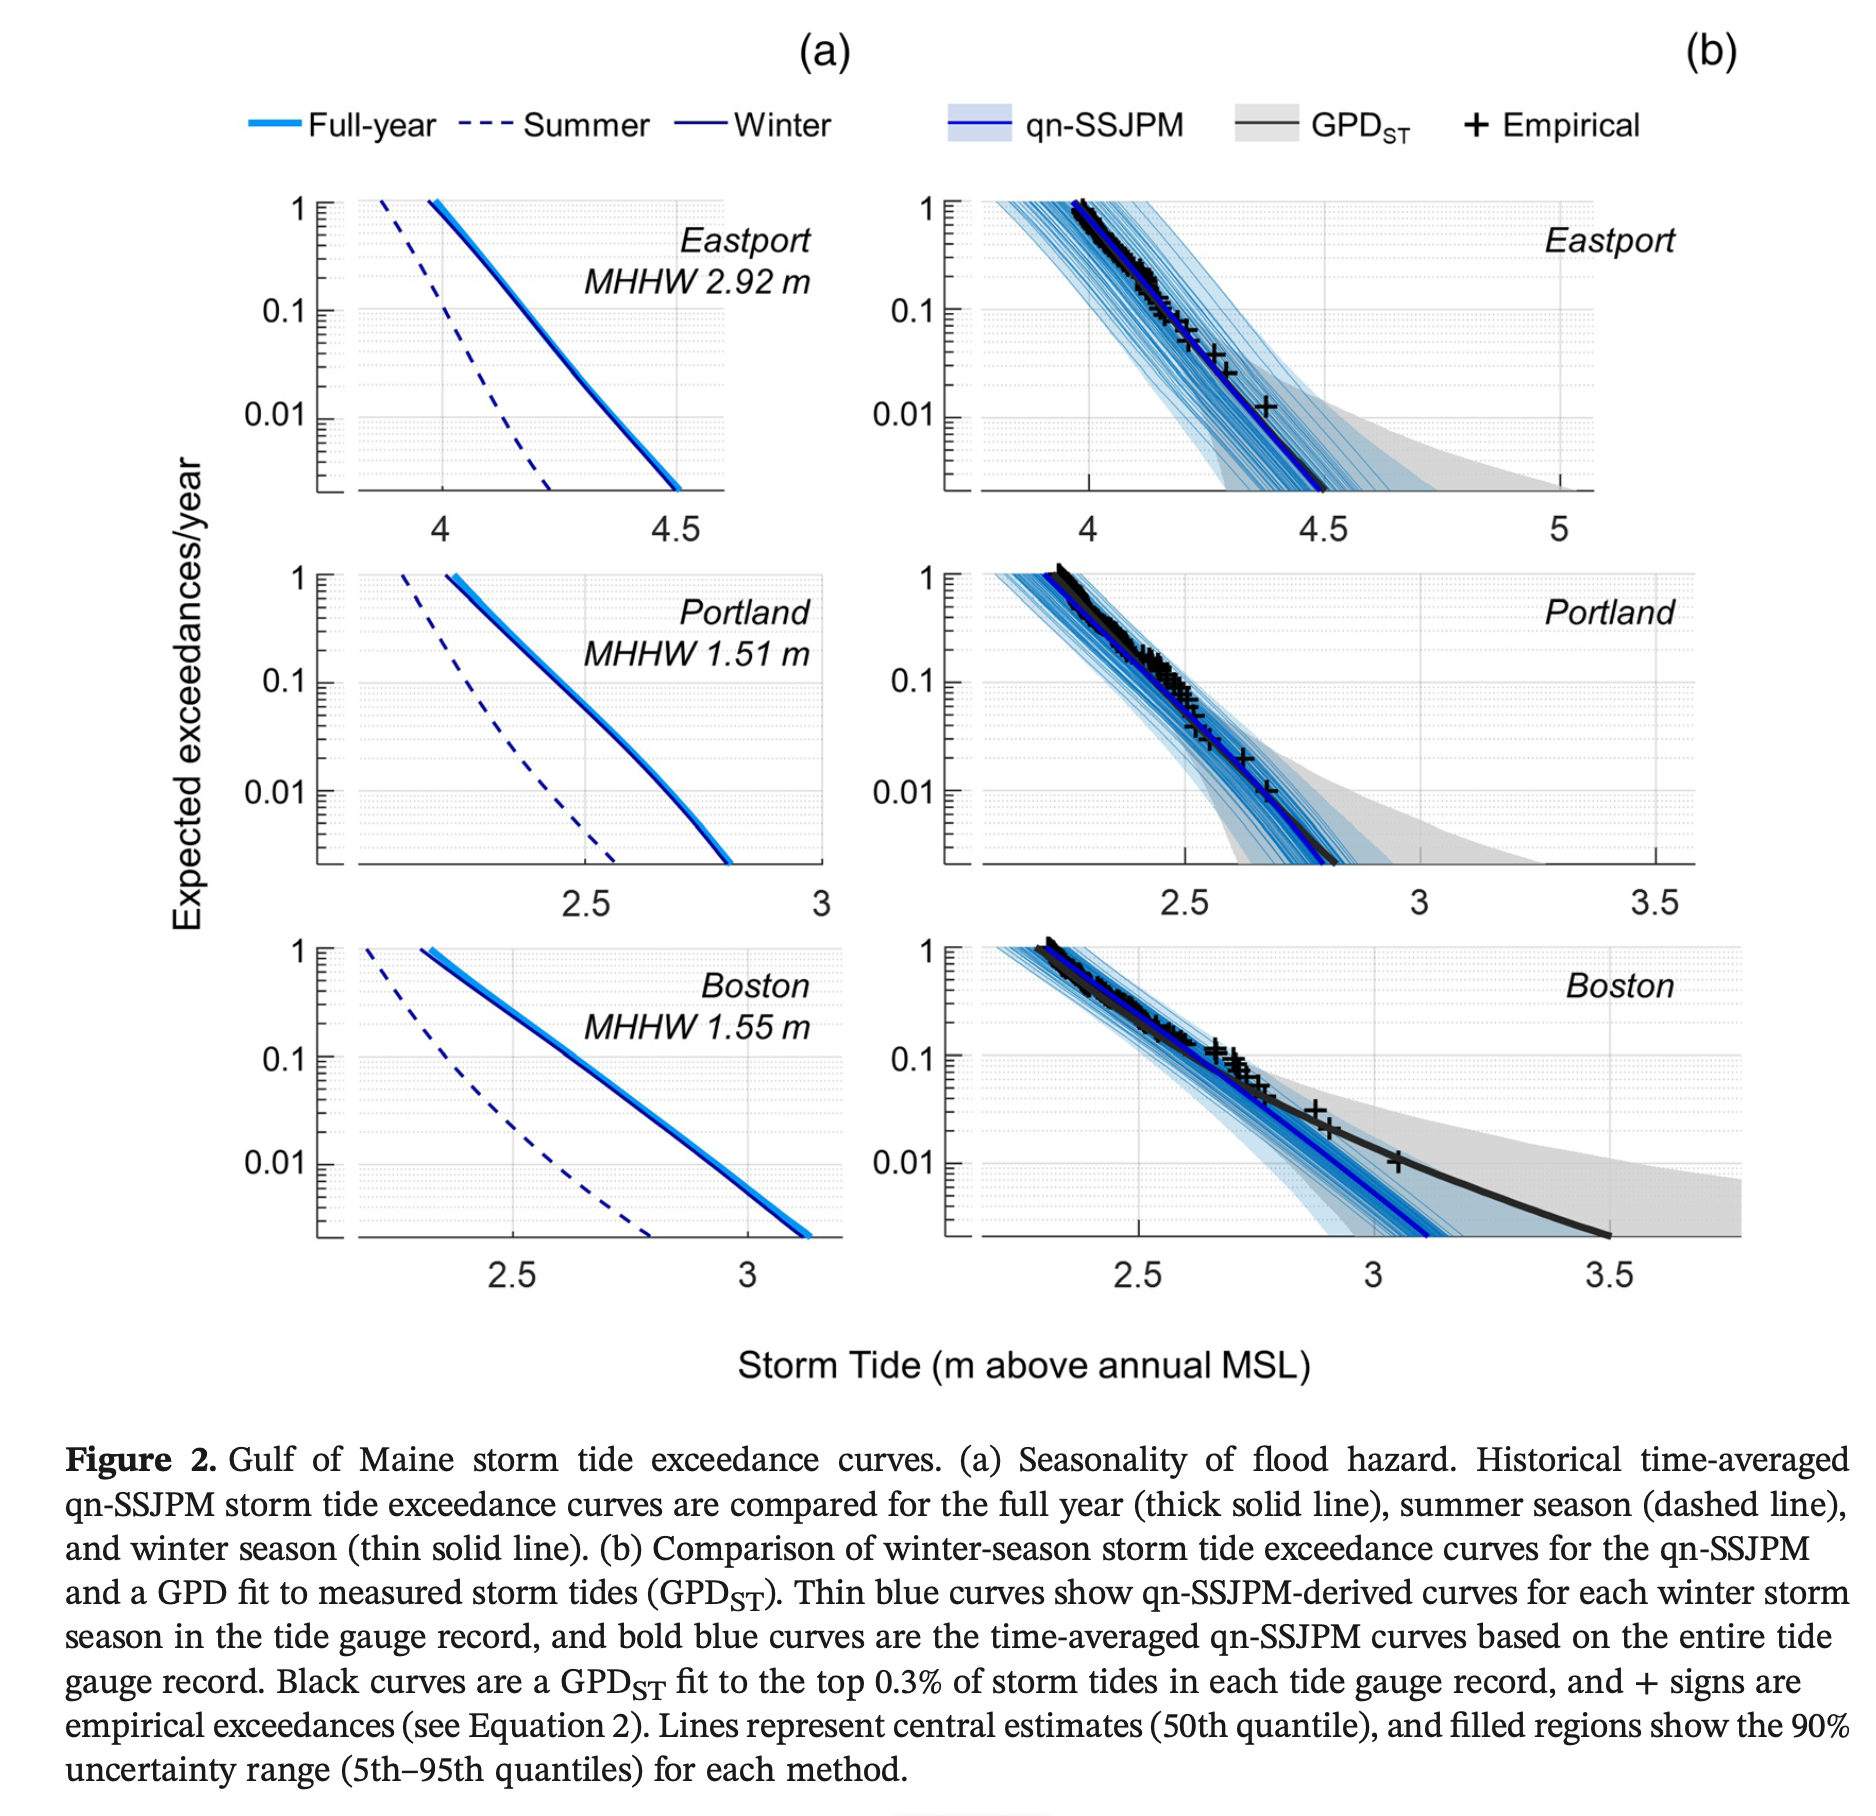
Compare the plot above with the Portland subplot in Figure 2a from Baranes, et al 2020, https://doi.org/10.1029/2020JC016291, reproduced here...
Heatmap
Range of values
display(d3.extent(data.map(d => d.Elevation)));
display(d3.extent(data.map(d => d.Hi50)));
display(d3.extent(data.map(d => d.Int50)));
display(data)
Data
// read the tidy data file
const data = await FileAttachment(`./data/portland_exceedance_array_tidy.csv`).csv({typed: true});

display(data)
Import
// import the exceedance lookup-table
import {exceedance, assetHeight} from "./components/exceedance.js";

// verify the lookup table
const d1 = data.filter(d => (d.Year == year) && (d.Elevation == elevation))[0];
const d2 = exceedance(elevation, year);

display( data )  // tidy exceedance
display( data.filter(d => (d.Year == year)) ) // filtered by year
display( data.filter(d => (d.Elevation == elevation)) )  // filtered by elevation
display( d1 ) // filtered by year & elevation
display( d2 ) // from the lookup table -- should be identical to previous except for special cases

if (d1.Hi50 != d2.Hi50) display("Problem with exceedance lookup")